POINT CLOUDS: what it is and what it is for
March, 05, 2020
Topic: Point Cloud
(8 min read)
Since ancient times, man has used any type of tool and methodology to calculate distances, make complex mathematical calculations, to take measurements and try to bridge those distances that seemed insurmountable.
The technological development, over the centuries, has radically changed all previous measurement activities, making operations that previously would have required an enormous amount of time and effort, much faster and easier to perform.
The introduction of 3D technology and the generation of point clouds undoubtedly represent one of today’s best forms of geometric data acquisition.
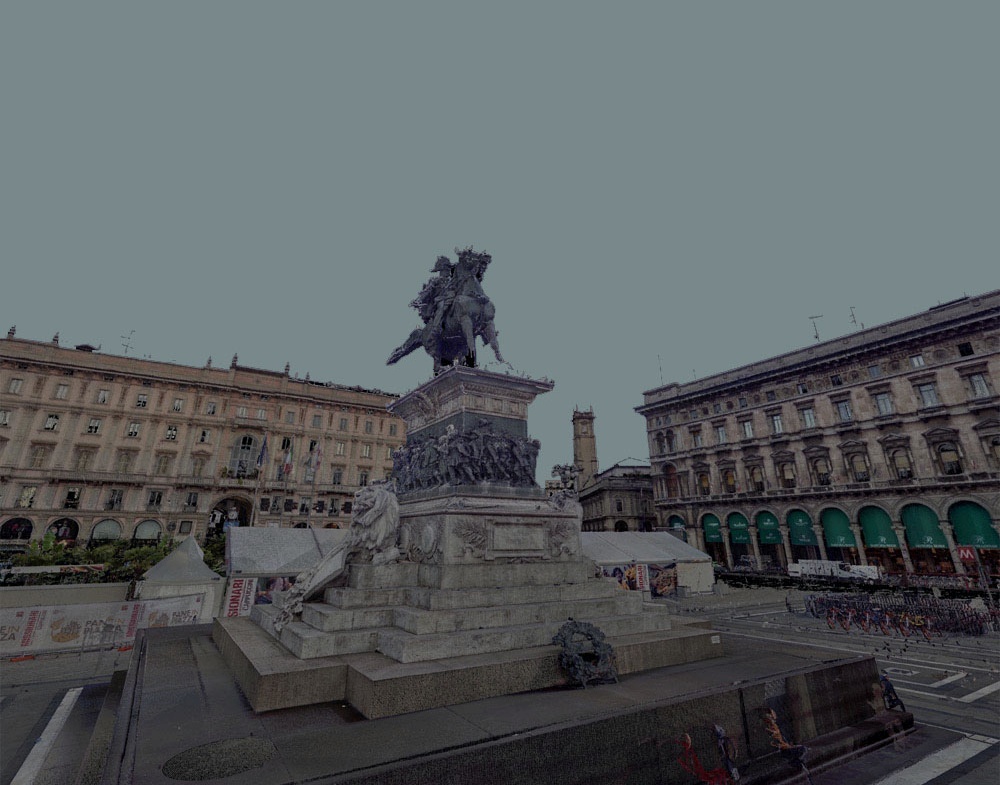
What is the point cloud?
The point cloud is defined as the result of an extensive collection of points positioned in the digital space, acquired by 3D laser scanner or other technologies, to create 3D representations of existing structures.
In other words, the point cloud that is generated represents a digital transposition of reality, composed of millions of points in space defined by unique geometric coordinates, not connected to each other and in different cases, integrated by information on the surface color.
Certainly the laser scanner survey technique and the consequent generation of the point cloud represents one of the best forms of data acquisition in circulation, since the acquired data contains all the geometric information of the detected object.
The advantages that derive from this method are very important, in particular the timing of acquisition has been significantly reduced, guaranteeing an excellent and exhaustive final result. However, the point cloud is not able to automatically define the characteristics of the building components, limiting itself to documenting only what the instrument identifies, namely the external envelope of the buildings investigated.
The next step to get this kind of information will be to combine it with the creation of an smart BIM model.
What is it for?
The applications and reasons why the point cloud is generated are different. Having a three-dimensional model of any object compared to traditional geometric information undoubtedly guarantees numerous advantages including:
- being able to move freely within the scanned object
- select the affected portion for a more accurate analysis
- take measurements on the 3 axes
- have key information on the real state of an infrastructure or a property for maintenance, restoration or redevelopment purposes.
- etc
In addition, as seen previously, in combination with BIM, the point cloud is used as the basis for the generation of an intelligent 3D model, so as to provide all that information concerning the characteristics of the building composition that basically the only point cloud cannot give.
Operations on the main software
There are several operations that can be done with a point cloud, much depends on the type of software used for reading the cloud. Among the main software on the market today we mention only some of the most famous and used, each with its own and interesting features: Cloud Compare, Autodesk Revit and Recap, Autocad Map and Civil 3D, Leica Cyclone, 3DF Zephyr, Point Sense and FARO scenes, ArcGIS, etc.
These are some of the main operations that can be done with a point cloud:
- Exploration: certainly one of the most comfortable and practical operations, namely having the possibility to freely navigate and move 360 ° within the clouds.
- Segmentation: among the most common operations applicable to the point cloud there is segmentation, or a separation of the portions of the cloud that identify the components of the detected object. The only big limitation of segmentation is that it is not yet fully automated, but this does not always represent such a negative aspect, indeed perhaps it could sometimes be seen as an advantage since human control of the digital result, in order to having a total understanding of the scanned object is essential.
- Extraction: by selecting a portion of the point cloud, it is possible to extract the underlying 2D geometry by creating a drawing corresponding to 2D lines, defining a series of parameters including the layer on which it is created, the color of the lines and polylines, tolerance settings, etc.
- Color stylization: means being able to apply different styles to point clouds to analyze the characteristics within the point cloud itself. The optional styles are chosen based on the original scan colors, the color of the object, the direction of the point normals and the intensity of the laser pulse return, elevation or LAS classification data.
- Scan Colors (RGB): Applies a style to each point based on the original scan colors.
- Object Color: Applies a style to each point based on the color property of the point cloud object which may vary depending on the lighting settings.
- Normal: applies a style to each point based on the direction of the point normal according to an unchangeable default color scheme (When a point cloud is acquired during a scan, a normal direction vector can be calculated for each point based on to the surrounding points. In this way, the scanner software deduces flat or curved areas. The normal of a point is therefore represented by a vector perpendicular to the flat or curved surface deduced. Using the integrated colors assigned to the X, Y and Z directions of the point cloud, stylization based on normals has the effect of assigning one of these colors to each point according to the direction of the normal for that point. The more the normal is located near the X, Y or Z direction in the drawing , the more the color of the point will be close to that assigned to that axis).
- Intensity: apply a style to each point based on the intensity value of the laser pulse return (During the acquisition process, the scanners identify an intensity value for each point. The intensity represents a measure of the reflectivity of the points, which may vary depending on the color, the composition of the surface, the angle of the surface and the environment).
- Elevation: apply a style to each point based on its Z value.
- Density: each cloud of points has its own density and is directly proportional to the acquisition time. The longer the scan, the more detailed and above all the greater the points acquired. By increasing or decreasing the number of visible points, different software allows you to simplify the display of the point cloud, thus improving the performance of the program.